Arithmetic mean
In mathematics and statistics, the arithmetic mean, often referred to as simply the mean or average when the context is clear, is a method to derive the central tendency of a sample space. The term "arithmetic mean" is preferred in mathematics and statistics because it helps distinguish it from other means such as the geometric and harmonic mean.
In addition to mathematics and statistics, the arithmetic mean is used frequently in fields such as economics, sociology, and history, though it is used in almost every academic field to some extent. For example, per capita GDP gives an approximation of the arithmetic average income of a nation's population.
While the arithmetic mean is often used to report central tendencies, it is not a robust statistic, meaning that it is greatly influenced by outliers. Notably, for skewed distributions, the arithmetic mean may not accord with one's notion of "middle", and robust statistics such as the median may be a better description of central tendency.
Contents |
Notation
The arithmetic mean of a variable is often notated with a bar, for example  would be the mean of some set of data x. would be read as "x bar".
Definition
Suppose we have sample space  . Then the arithmetic mean
  is defined via the equation
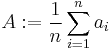 .
.
If the list is a statistical population, then the mean of that population is called a population mean. If the list is a statistical sample, we call the resulting statistic a sample mean.
Motivating properties
The arithmetic mean has several properties that make it useful, especially as a measure of central tendency. These include:
- If numbers
 have mean X, then
  . Since
  is the distance from a given number to the mean, one way to interpret this property is as saying that the numbers to the left of the mean are balanced by the numbers to the right of the mean. The mean is the only single number for which the residuals defined this way sum to zero.
 - If it is required to use a single number X as an estimate for the value of numbers , then the arithmetic mean does this best, in the sense of minimizing the sum of squares (xi − X)2 of the residuals. (It follows that the mean is also the best single predictor in the sense of having the lowest root mean squared error.)
- For a normal distribution, the arithmetic mean is equal to both the median and the mode, other measures of central tendency.
Problems
The arithmetic mean may be misinterpreted as the median to imply that most values are higher or lower than is actually the case. If elements in the sample space increase arithmetically, when placed in some order, then the median and arithmetic average are equal. For example, consider the sample space {1,2,3,4}. The average is 2.5, as is the median. However, when we consider a sample space that cannot be arranged into an arithmetic progression, such as {1,2,4,8,16}, the median and arithmetic average can differ significantly. In this case the arithmetic average is 6.2 and the median is 4. When one looks at the arithmetic average of a sample space, one must note that the average value can vary significantly from most values in the sample space.
There are applications of this phenomenon in many fields. For example, since the 1980s in the United States median income has increased more slowly than the arithmetic average of income. Researchers dealing with frequency data must also be careful when reporting summary statistics such as means or median. Where a phenomenon is rare in general (for example, emergency room visits among the general population), but occurs frequently in some people (for example, dare devils), then the mean value may be much lower than the median.
Angles
Particular care must be taken when using cyclic data such as phases or angles. Naïvely taking the arithmetic mean of 1° and 359° yields a result of 180°. This is incorrect for two reasons:
- Firstly, angle measurements are only defined up to a factor of 360° (or 2π, if measuring in radians). Thus one could as easily call these 1° and −1°, or 1° and 719° – each of which gives a different average.
- Secondly, in this situation, 0° (equivalently, 360°) is geometrically a better average value: there is lower dispersion about it (the points are both 1° from it, and 179° from 180°, the putative average).
In general application such an oversight will lead to the average value artificially moving towards the middle of the numerical range. A solution to this problem is to use the optimization formulation (viz, define the mean as the central point: the point about which one has the lowest dispersion), and redefine the difference as a modular distance (i.e., the distance on the circle: so the modular distance between 1° and 359° is 2°, not 358°).
See also
Further reading
- Darrell Huff, How to lie with statistics, Victor Gollancz, 1954 (ISBN 0-393-31072-8).
Reference list
External links
- Calculations and comparisons between arithmetic and geometric mean of two numbers
- Weisstein, Eric W., "Arithmetic Mean" from MathWorld.
|
|||||||||||||||||||||||||||||||||||||||||||||||||||||||||||||||||||||||||||||||||||||||||||||||||||||||||||||||||||||||||||||||||||||||||||